

Guillaume Detrait, President & Chief Risk Officer [email protected]

Dr. Oren Rosen, PhD, CAIA, Portfolio Manager, Systematic Macro and Trend Strategies [email protected]
Many investors are rediscovering Quant Macro and Trend Following after a bruising 2022 for equities, bonds, and other asset classes. The S&P 500 lost -18%, but worse, bonds lost -13% when they were supposed to provide much relied-upon diversification. By comparison, indices like the SG Trend Index returned +27% in 2022, recapturing investors’ interest in Quant Macro and Trend Following. And while 2022 served as a reminder for some, other investors may have little to no familiarity with these strategies and are motivated to learn more.
This post does not aspire to answer every question one might have, but it will focus on a few of the most central questions for investors:
What are the performance drivers for these strategies, are they present now, and will they persist?
To answer these questions, we will analyze the historical returns of the SG Trend Index, which is comprised of ten of the largest trend following CTAs within the managed futures space.
Below-left is a continuous series plot spanning Jan 2000 – May 2023, exactly as one would typically view it. However, we propose that a more illuminating approach is to isolate each decade as shown below-right.
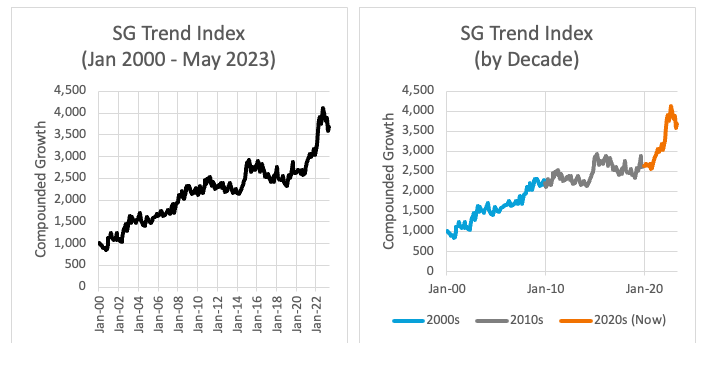
PAST PERFORMANCE IS NOT NECESSARILY INDICATIVE OF FUTURE RESULTS.
In the next chart, we created an overlay of each decade to identify similarities and differences between them.
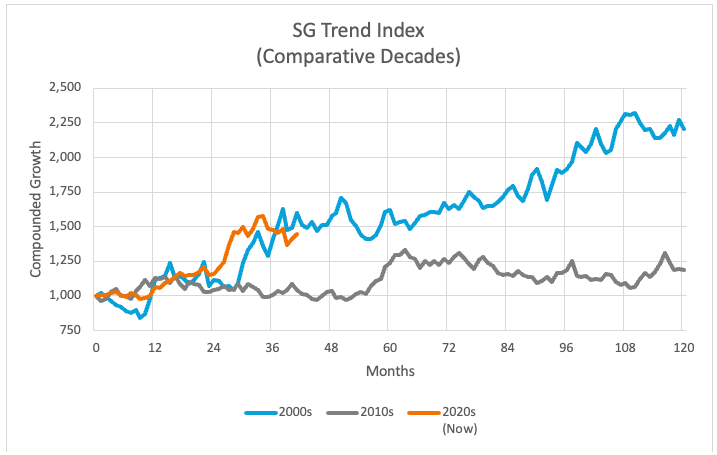
PAST PERFORMANCE IS NOT NECESSARILY INDICATIVE OF FUTURE RESULTS.
The above view more easily reveals the presence (in the 2000s and 2020s) and the absence (in the 2010s) of the necessary conditions for Quant Macro and Trend Following to do well. But what are these conditions?
What are the performance drivers for Quant Macro and Trend Following?
Quant Macro and Trend Following strategies tend to do well during periods of ordinary macroeconomic turbulence and functioning dynamic markets. Factors like interest rate fluctuation, inflation/deflation, geopolitical shifts, GDP growth or contraction, labor costs, and unemployment generally induce this macroeconomic turbulence. Differentials between and among countries rippling across all four market sectors (equities, fixed income, currencies, and commodities) typically provide managers with a fertile opportunity set for their strategies.
The 2000s were one such decade and included events such as 9/11, multiple accounting scandals (e.g., Enron, WorldCom), the second Gulf War, the commodity super cycle, the bursting of the tech bubble, and the Great Financial Crisis. This dynamism and turbulence drive market opportunities, and resulting gains in the 2000s can be seen as the bright blue line in the chart above.
While the exact events will always vary, each decade is typically characterized by a handful of sizeable shocks and transformations. For example, although it’s not pictured, the 1990s is generally remembered as a time of booming prosperity within the US, but it also included Desert Storm, the collapse of the Soviet Union, a surge in labor productivity due to technology, Long-Term Capital Management, the Asian Financial Crisis, and the Russian Financial Crisis. The 1980s included: stagflation, two recessions within three years, the Savings & Loan Crisis, Black Monday, and the fall of the Berlin Wall. Similar lists exist for the 1970s, 1960s, etc.
And this raises an important point for investors and allocators, which is that while these strategies may have garnered attention for outsized returns in 2022, their ability to perform is not limited to a handful of years alone. As shown, each decade generally provides the requisite macro volatility for opportunity. Secondly, as shown in the compounded growth charts since January 2000 on page 1, the SG Trend Index has a positive return expectation over time. Taken together, these facts suggest that investors may well miss significant returns trying to time their entry into these strategies and may benefit more with steady long-term exposure to them as part of a well-diversified portfolio.
Are these favorable macroeconomic conditions present today, and will they persist?
The orange line above represents the 2020s, and one can see the SG Trend Index is generally tracking that of the 2000s. Why? Like the 2000s, our present decade has experienced a return to ordinary macroeconomic volatility, and we believe this condition should persist for years to come.
The COVID-19 global pandemic started things off in March 2020, exposing vulnerabilities in global supply chains, disrupting global supply/demand, and halting labor around the world. Today central bankers are fighting inflation by spiking interest rates in the hopes of averting global recession, and we face secular forces such as increasing energy costs across Europe. We face new geopolitical risks in the form of the Ukraine war, US-China competition, and Taiwan and South-East Asia tensions. Finally, deglobalization efforts are likely to massively shift developed countries’ investments away from developing economies over the next decade.
Looking forward, do we have reason to believe these genies will soon return to their bottles and that more bottles will not be opened in their place? We don’t think so. If anything, the list of likely macroeconomic and geopolitical disruptions lengthens the more one ponders it. For example, consider fluctuating growth dynamics among the developed and developing world, natural resource constraints, demographic change, decarbonization costs, energy demand, AI’s impact on productivity and employment, and the trade implications of weakening liberal democracies globally.
Lastly, perhaps the strongest reason we believe that macroeconomic forces will persist is because developed countries are less capable of suppressing them. Massive stimulus programs to prevent or slow the unpleasant half of the economic cycle are increasingly difficult to fund, and debt servicing costs are soaring as many developed countries’ debt-GDP ratios exceed 100%.
What about the gray line? Why didn’t Quant Macro and Trend Following perform as well during the 2010s?
Great question, and it needs answering because Quant Macro and Trend Following significantly underperformed during this period. This can be seen in the comparative decade charts below. Most notably, the SG Trend Index returned only 1.8% per annum during this decade, which is significantly lower than the SG Trend Index’s full track record average of 5.7% per annum.
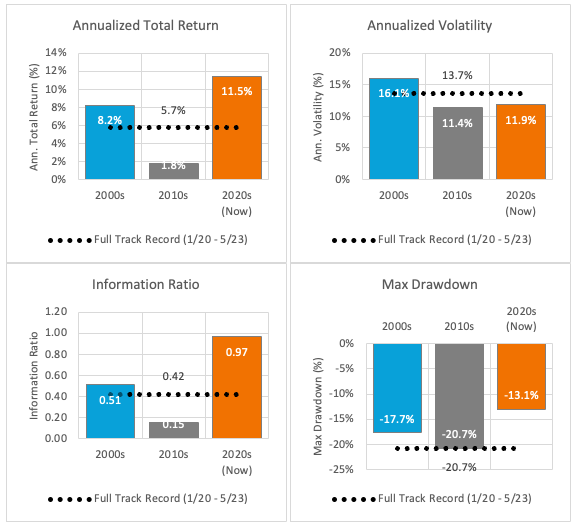
PAST PERFORMANCE IS NOT NECESSARILY INDICATIVE OF FUTURE RESULTS.
So why did this happen? Recall that both Quant Macro and Trend Following tend to perform during periods of ordinary macroeconomic turbulence and functioning dynamic markets. Unfortunately, the 2010s had little of both.
This was an anomalous period characterized by abnormally low volatility due to massive monetary policies and quantitative easing from central banks post-Global Financial Crisis and post-Euro Crisis. This kept asset values artificially high, and price trends had difficulty developing due to suppressed market volatility. For example, equity market selloffs driven by concerns about economic growth were met with aggressive monetary easing, causing subsequent rebounds in price. Like past decades, the 2010s also experienced disruptions, but their impact was stifled. Financial controls muted the reverberations of large events like Brexit and the Euro Debt Crisis. Quantitative Easing and ZIRP were the dominant forces of central bank financial repression, and as a result, market volatility and price trends hit historic lows. Even major events had muted effects in a world of low and negative rates.
# # #
The SG Trend Index is designed to track the largest trend following CTAs and be representative of trend followers in the managed futures space. It is comprised of the largest 10 managers by AUM who meet a variety of criteria, including: must trade a primarily futures-based strategy; must be broadly diversified across asset classes and/or markets; must be an industry-recognized trend follower with a significant correlation to peers; must be open to new investment; and must report returns net of fees on a daily basis. The index is equally weighted, and it is rebalanced and reconstituted annually on January 1st. The index inception date is January 1st 2000, and it is managed by Societe Generale.
THE OPINIONS EXPRESSED ARE THOSE OF THE AUTHOR OR THE INDIVIDUAL TO WHOM THE STATEMENTS ARE ATTRIBUTED. WHILE BELIEVED TO BE REASONABLY BASED ON FACT AND INQUIRY, THERE CAN BE NO GUARANTEES THAT SUCH OUTCOMES EXPRESSED OR IMPLIED HAVE OCCURRED OR WILL INDEED OCCUR.
THIS DOCUMENT IS NOT A SOLICITATION FOR INVESTMENT. SUCH INVESTMENT IS ONLY OFFERED ON THE BASIS OF INFORMATION AND REPRESENTATIONS MADE IN THE APPROPRIATE OFFERING DOCUMENTATION. ANY INVESTMENT PROGRAM DESCRIBED HEREIN IS SPECULATIVE, INVOLVES SUBSTANTIAL RISK AND IS NOT SUITABLE FOR ALL INVESTORS. NO REPRESENTATION IS BEING MADE THAT ANY INVESTOR WILL OR IS LIKELY TO ACHIEVE SIMILAR RESULTS.
PAST PERFORMANCE IS NOT NECESSARILY INDICATIVE OF FUTURE RESULTS.