

Dr. Patrick Welton Founder and Chief Investment Officer [email protected]

Guillaume Detrait, President & Chief Risk Officer [email protected]
A drawdown is a decline following a recent peak of investment gains. Most investments have them, and they share one thing in common. Nobody likes them.
Behaviorally, many feel emotional tension, their minds still anchoring on the recent high. Investors’ natural aversion can result in actions or inactions well-described in the field of Behavioral Finance that can worsen their outcomes and create value opportunities that others can exploit. The best strategic and tactical investors harness a disciplined pursuit of value to capture the available excess return. In the following pages, we explore this value creation in more depth.
For highly diversified strategies like Quant Macro and Trend Following, the tendency for drawdowns is not symptomatic of a problem but rather an inherent aspect of market fluctuations and asset class rotations. Quant Macro and Trend Following capture valuable directionality and downside performance for investors and, therefore, move when markets move, performing as intended. In other words, drawdowns come with the territory for the same reasons that performance run-ups do.
Quant Macro and Trend Following drawdowns are mid-range compared to other diversified assets. They are about one-third the size of a concentrated growth stock portfolio, one-half the drawdowns of broad equity indices, and about double the size of unlevered high-quality credit indices. And for this reason, we believe it is helpful to demonstrate the value zones that drawdowns create for disciplined investors. Remindful that for all these investments and more, the investment’s portfolio role and lengthy track record (inclusive of all periodic drawdowns) attracted the investor’s attention in the first place.
To illustrate, we will choose one example though the lessons apply to many. In this post, we will examine the largest drawdowns experienced by the benchmark SG Trend Index for insights. In so doing, we will attempt to answer common investor questions, specifically…
How large have drawdowns been for Quant Macro and Trend Following? And have they varied for any reason over time?
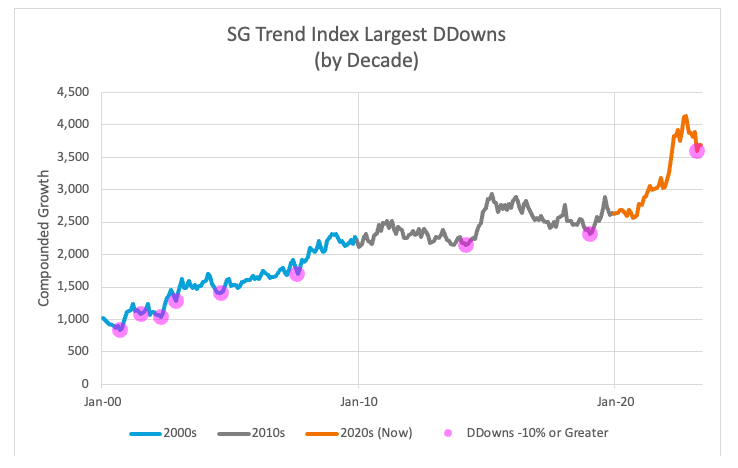
Below we have plotted all drawdowns greater than -10% in the SG Trend Index spanning Jan 2000 – May 2023, color-schemed by the decade during which they occurred.
PAST PERFORMANCE IS NOT NECESSARILY INDICATIVE OF FUTURE RESULTS.
The purpose of plotting these significant drawdowns by decade is to help the viewer distinguish between two representative periods. As more fully explained in our earlier post, “Performance Drivers Return for Quant Macro and Trend Following,” the 2010s decade (gray line) was economically interesting but highly anomalous. Many asset classes were severely distorted. For instance, cash spent as long as 7 years with zero returns, a wealth-depleting level of negative 2-3% real returns, all but eliminating cash from its historical role in many asset allocation studies. The profound and unprecedented global central bank policies of Quantitative Easing and prolonged zero interest rate policies following the Global Financial Crisis also depleted the main macroeconomic change and market volatility return drivers of Quant Macro and Trend Following. By comparison, the 2000s (bright blue line in chart) and 2020s (orange line), like decades before, are characterized by more ordinary unobstructed macroeconomic forces.
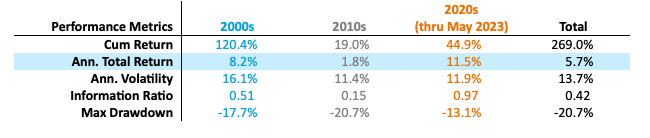
These differences are also apparent when comparing the summary statistics for each decade below and will help us as we explore drawdowns further below.
PAST PERFORMANCE IS NOT NECESSARILY INDICATIVE OF FUTURE RESULTS.
Do drawdowns signify a problem? Do they portend future losses?
Drawdown interpretation depends on the asset in question.
Individual companies can become insolvent, a single real property can become fully impaired, and particular bonds can default. For solitary assets, drawdowns can be the beginning of outright loss. Think of Enron in 2001. For something more contemporary, watch specific issuances default in the forthcoming likely commercial office debt implosion.
For inherently diverse assets, drawdown interpretation is different. Drawdowns, like run-ups, simply reflect changes in collective value. Diverse ownership of hundreds or thousands of companies, properties, and debt instruments across many economic sectors and geographies through broad indices exposes the investor to their rise and fall based on pricing. Individual failure is expected and unconcerning. The failure of any one asset is carried by the surviving hundreds. Without systemic problems to the financial system or devastation brought by events like war, neither portends future losses. They will have periods when each does better or worse, and these portfolios will be in a drawdown when they are worth less than their very most recent high.
Diversified Quant Macro and Trend Following share this characteristic. As investments, they have analogous, if not stronger, diversification. They invest in hundreds of markets across multiple asset classes at generally higher economic levels than individual companies ranging from sovereign bonds and currencies to primary global commodities covering all aspects of energy, metals, and agricultural markets to equity indices composed of thousands of companies listed in dozens of major countries around the world. Furthermore, they do not use borrowed money and are directionally diversified. These strategies inherently can go long and short, recognizing return potential from both over and undervaluations in markets fueled by further selling or buying.
Are there any interesting features to observe in drawdowns?
A few.
Generally, drawdowns will be larger for investment classes that are liquid, more volatile, use borrowed money, and have an asymmetry in ownership. These aspects are routinely seen in assets like equities. When nearly all investors are long and decide to sell, whether from fear, news, the need for liquidity, or all the above, losses can be swift and painful. This is the source of the famous “left tail.” In some narrow investment classes with high borrowing levels, this drawdown effect magnifies as equity depletes and credit withdraws. When the investor and lender simultaneously wish to sell an investment with borrowed money, there are infamous examples like LTCM, where the left tail leads to zero or below.
For diversified strategies like Quant Macro and Trend Following, the main observation about drawdowns is that they generally do not show extreme left tails. A characteristic of the strategy class is to exit nonproductive or losing investments while keeping productive, profitable trades for much longer. The strategy class also generally manages within well-defined volatility levels, so as market volatility soars, the strategies often reduce the size of their holdings for risk control. The result is that drawdowns simply recur proportionate to risk and tend to act as observed over the past 23 years.
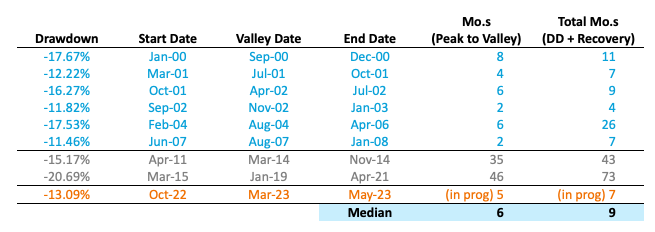
Minor observations include length and frequency. Drawdowns tend to be longer, not necessarily deeper, during periods of low opportunity as returns take time to reach a new high. In contrast, they tend to be shorter in duration but more frequent during times with high market return opportunities. The following table shows that 2/3rds of the largest drawdowns (pink dots) occurred during the index’s best full decade of historical performance.
PAST PERFORMANCE IS NOT NECESSARILY INDICATIVE OF FUTURE RESULTS.
Do you have any advice for timing one’s investment?
Yes: be strategic in purpose, disciplined in process, and allocate with value.
Strategically, we recommend a disciplined review of market conditions and requisite performance drivers. In the case of Quant Macro and Trend Following, this means an environment of ordinary macroeconomic turbulence and functioning dynamic markets. Example factors are interest rate fluctuation, inflation/deflation, geopolitical shifts, GDP growth or contraction, labor costs, and unemployment. And the less consensus and the more variation between and among countries, the better, as dispersion and volatility increase the opportunity set.
With respect to the process, in our opinion, any disciplined decision framework applied consistently over time will outperform. A process that aligns mathematically with excess returns will likely do even better. The cycle of enthusiasm, excitement, worry, and fear following investments in any class is a never-ending source of negative investor alpha. Many have read, but too few have taken to heart Warren Buffet’s aphoristic advice to be fearful when others are greedy and greedy when others are fearful. It is a declaration of action against emotion and over-valuation.
That’s nice, but what about investing during a drawdown?
We know the timing of an investment decision weighs heavily on investors, particularly in the throes of a drawdown. We still hear quotes like:
“We’re going to pause, given the current drawdown.”
“We’d like to see a few months of positive performance before committing.”
Aside from being asset managers, we are students of the markets and investing. We want all investors to enjoy better outcomes. Better returns on capital better fund the missions and beneficiaries of that capital. It motivates us to communicate observations in the markets that we hold true and that other investors can use. Drawdowns are a window into one of our most reliable observations of all. In all of investing, across all asset classes, during all observed eras, the markets make investors pay for comfort. This common investor behavior creates increased opportunities for other disciplined strategic investors.
Historically, investing in a drawdown yields superior forward returns.
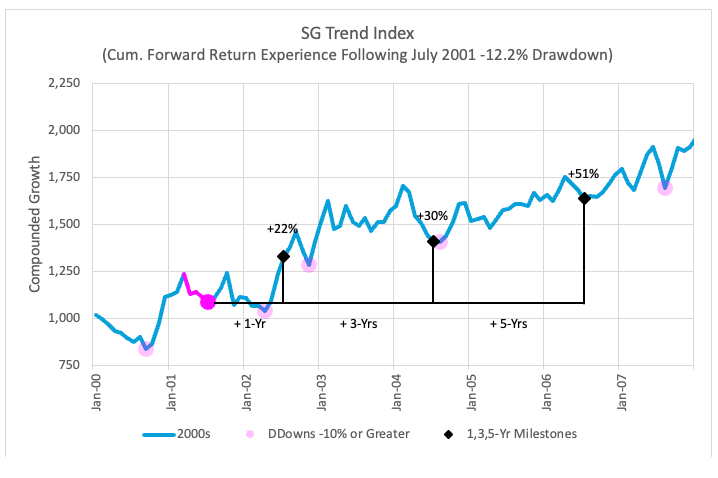
To illustrate the potential excess return for entering Quant Macro and Trend Following during a value zone created by a drawdown, we pose and answer a simple question: “What was the forward 1-, 3-, and 5-year cumulative return experience if one invested at the valley of each drawdown in excess of -10%, in the history of the SG Trend Index? Depicted visually, one case of the analysis looks like this:
PAST PERFORMANCE IS NOT NECESSARILY INDICATIVE OF FUTURE RESULTS.
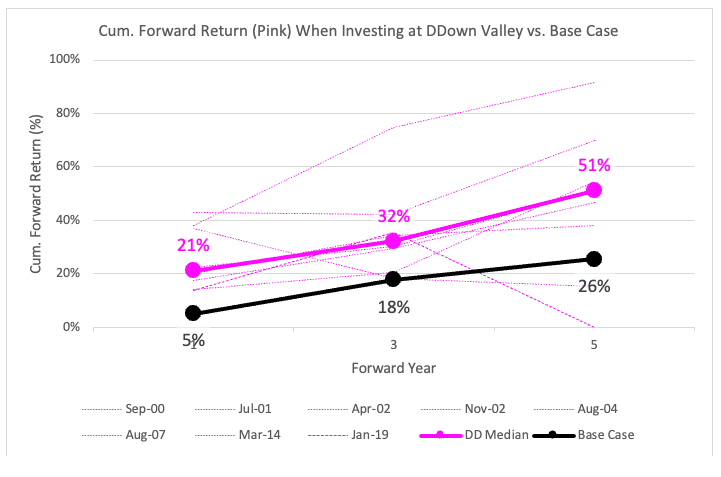
We selected the July 2001 valley drawdown for depiction because it is the most representative of the median composite drawdown investment experience examined. We listed all in the table below. The median cumulative forward returns for all eight drawdowns studied were also roughly 20%, 30%, and 50% over 1, 3, and 5 years respectively. This is materially greater than the average base case entry point since 2000, yielding 5%, 18%, and 26% over 1, 3, and 5 years, respectively.
Note the inherency of drawdowns as part of the ordinary investor experience, even during a period of robust performance. As shown above, investors endured three more drawdowns in excess of -10% within five years of July 2001, as cumulative returns marched forward attractively. The recurrence of drawdowns is simply the flip side to the recurrence of run-ups in value.
This visual is presented to be educational and illustrative. No one can reliably know the bottom of a drawdown, but the benefits are the same if driven by an investment process allocating into value. We can directly observe from these data that, historically, markets reward disciplined investors for entering or increasing their allocations during value zones, such as those during the larger drawdowns. The meaningful excess returns align with other observations across asset classes and time. A subgroup of investors skillfully acts upon this, as many of our own investors do.
The complete analysis results appear in the table below and in the subsequent chart.
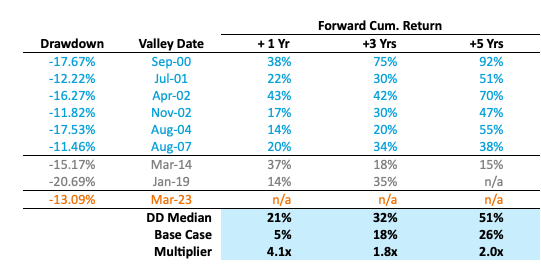
The average annualized volatility of the SG Trend Index for the January 2000-May 2023 period is 13.7%
PAST PERFORMANCE IS NOT NECESSARILY INDICATIVE OF FUTURE RESULTS.
PAST PERFORMANCE IS NOT NECESSARILY INDICATIVE OF FUTURE RESULTS.
So how can we benefit from value during drawdowns?
Do what many of our investors do. They strategically rebalance on a disciplined schedule. Whether by time or by performance band, they rebalance. The critical success factors are discipline and consistency.
For example, when in a 10% drawdown, their process will rebalance to fill in that 10%. In a 20% drawdown, the rebalance will fill in the 20%. That marginal allocation enjoys a generally higher return in the future while enjoying a faster recovery to new highs adding more compounding. Symmetrically, they rebalance capital away after a run-up. A disciplined process yields disciplined results. If not already invested, we observe the same strategic investor practices using drawdown value zones to enter tactically, all at once, or divided entries over a few months.
The benefit of the investment discipline produces higher excess expected returns at lower than average risk through the power of value entry and dollar cost averaging. Professional strategic investors garner an enduring advantage from investing more when there is more value and reap the returns cast away by others who stand aside.
# # #
The SG Trend Index is designed to track the largest trend following CTAs and be representative of trend followers in the managed futures space. It is comprised of the largest 10 managers by AUM who meet a variety of criteria, including: must trade a primarily futures-based strategy; must be broadly diversified across asset classes and/or markets; must be an industry-recognized trend follower with a significant correlation to peers; must be open to new investment; and must report returns net of fees on a daily basis. The index is equally weighted, and it is rebalanced and reconstituted annually on January 1st. The index inception date is January 1st 2000, and it is managed by Societe Generale.
THE OPINIONS EXPRESSED ARE THOSE OF THE AUTHOR OR THE INDIVIDUAL TO WHOM THE STATEMENTS ARE ATTRIBUTED. WHILE BELIEVED TO BE REASONABLY BASED ON FACT AND INQUIRY, THERE CAN BE NO GUARANTEES THAT SUCH OUTCOMES EXPRESSED OR IMPLIED HAVE OCCURRED OR WILL INDEED OCCUR.
THIS DOCUMENT IS NOT A SOLICITATION FOR INVESTMENT. SUCH INVESTMENT IS ONLY OFFERED ON THE BASIS OF INFORMATION AND REPRESENTATIONS MADE IN THE APPROPRIATE OFFERING DOCUMENTATION. ANY INVESTMENT PROGRAM DESCRIBED HEREIN IS SPECULATIVE, INVOLVES SUBSTANTIAL RISK AND IS NOT SUITABLE FOR ALL INVESTORS. NO REPRESENTATION IS BEING MADE THAT ANY INVESTOR WILL OR IS LIKELY TO ACHIEVE SIMILAR RESULTS.
PAST PERFORMANCE IS NOT NECESSARILY INDICATIVE OF FUTURE RESULTS.